UK C-Section Rates 2023: Stats, Perspectives & Guidance 2023
Commissioned by Miss Chrissie Yu MBBS (Lond.) MD (Lond.) FRCOG
Consultant in Obstetrics & Fetal Medicine
First published September 2023
Pregnancy and birth is an incredibly exciting time of life for expectant parents. But not all pregnancies end in a straightforward natural delivery. Interventions such as ventouse, forceps and even c-sections are sometimes unavoidable in a bid to deliver a healthy baby to a healthy Mother.
But how common are c sections in the UK today? How many of us would consider them a preferred choice? And how does the c section rate here compare with the rate globally? We take a look in our 2023 roundup of c section statistics. Let’s dive right in.
The Speedy Facts
If you don’t want to read over a thousand words, that’s ok. We’ve summed up our key findings here (with more context and information about these available within).
- 31% of births in the UK is by c section
- Around 16% of births are specifically by elective c section
- 15% of women over 16 in the UK (who have or expect to become pregnant in their lifetime) would opt for a c section birth given the choice
- 12.94% would opt for a home birth
- In the past 20 years, the c section rate in the UK has risen by roughly 50% from 1 in 5 to 1 in 3 births.
- 1 in 5 women in the UK say they have not and do not ever wish to become pregnant at all
- More than a quarter of women aged 25 to 34 would opt for a c section if given the choice
- There are 4 countries in the world where the C section rate is over half
- Since 2017, there has been an increase of 187% in terms of the number of people Googling “elective c section” in the UK
Elective C Section – How Many Women Would Choose a C Section in the UK?
Elective c sections are those which happen when the Mother and medical team know beforehand that the baby will be delivered this way. In other words, it is planned. Sometimes this is by choice of the Mother and sometimes certain medical conditions or pregnancy complications make a caesarean the safest way to deliver the baby.
We know in the UK that around 16% of births are by elective section. But we wanted to know how many women would prefer c section over other types of birth.
So we polled 1,040 women in the UK in August 2023 with the help of Censuswide, to ask them:
Think about previous or future pregnancies you may have. If given a choice, what type of birth, if any, would you have chosen/choose?
We gave respondents several options:
- C section
- Home birth
- Natural birth in a medical setting
- N/A – I haven’t / don’t want to get pregnant
- N/A – I didn’t/wouldn’t choose
- Prefer not to say
- Other
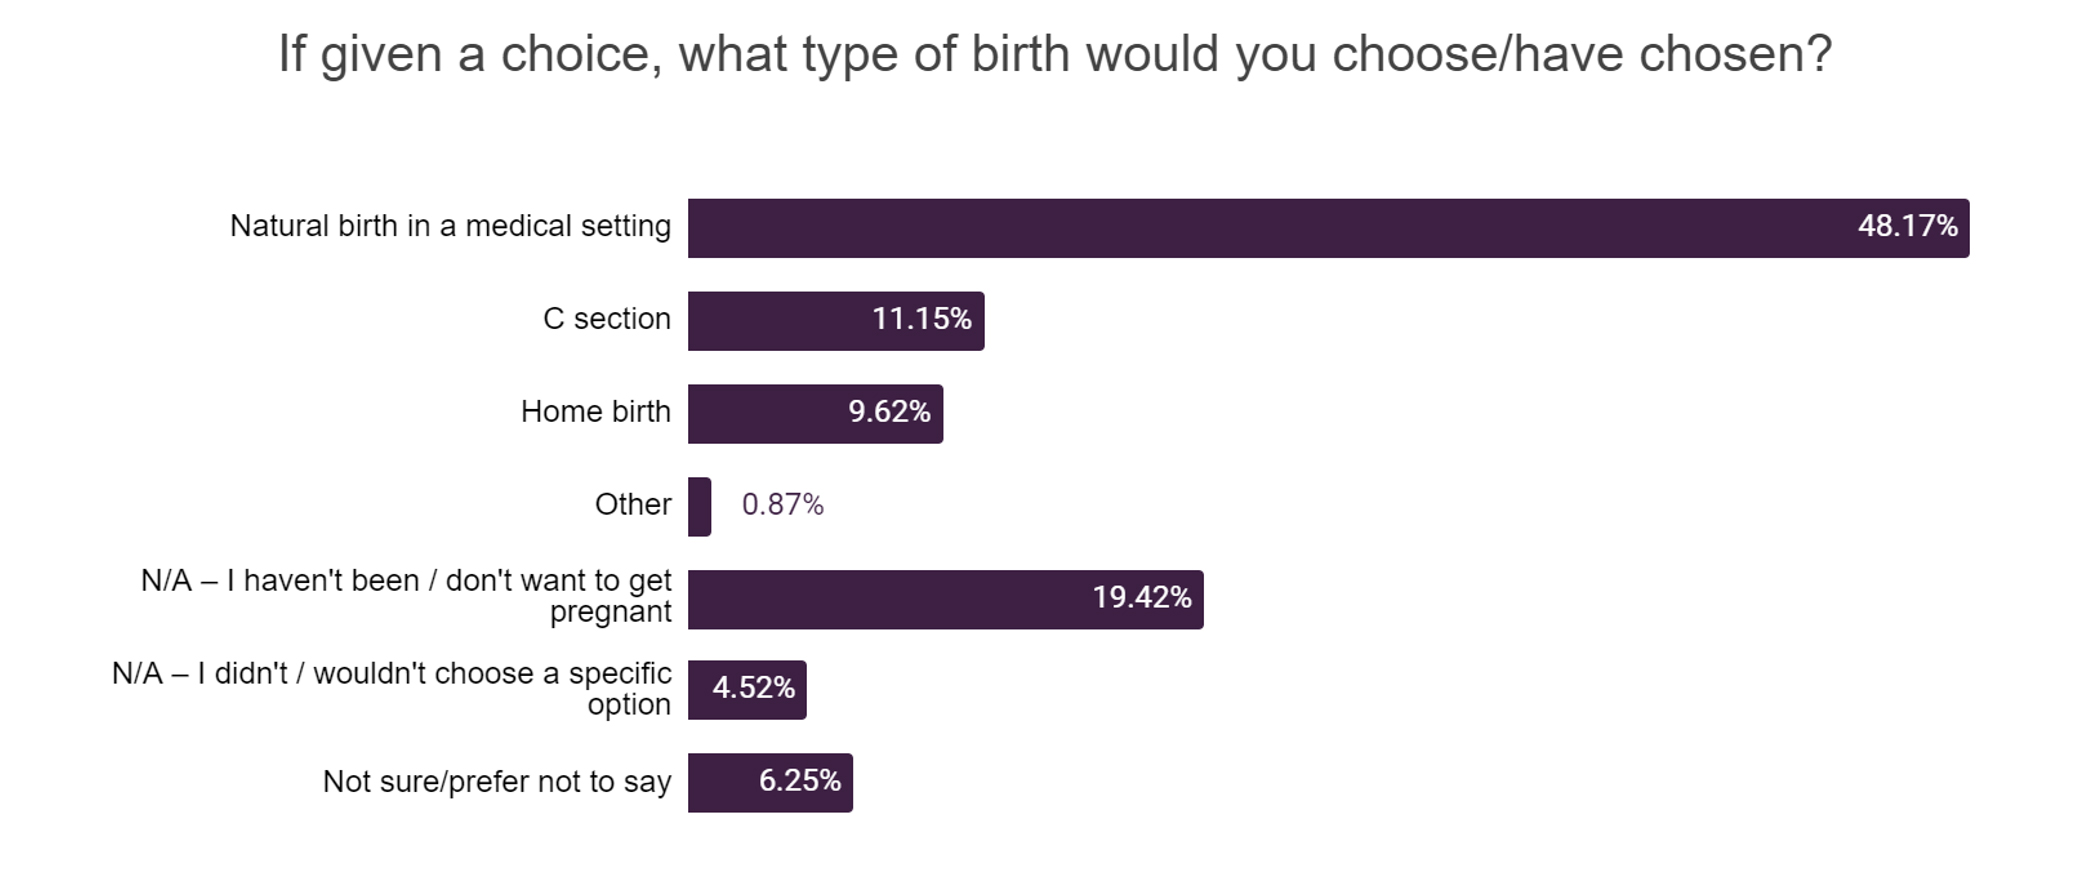
If we look at the raw responses we see this from our statistics:
| Think about previous or future pregnancies you may have. If given a choice, what type of birth, if any, would you have chosen/choose? | |
| Response | % of Women Who Gave this Response |
|---|---|
| Natural birth in a medical setting (hospital or birth centre) | 48.17% |
| N/A – I haven’t / don’t want to get pregnant | 19.42% |
| C section | 11.15% |
| Home birth | 9.62% |
| N/A – I didn’t / wouldn’t choose a specific option | 4.52% |
| Other | 0.87% |
| Not sure/prefer not to say | 6.25% |
To get a more accurate view of the wishes of those who have or hope to become pregnant, we removed from our data set all of those who answered:
- N/A – I haven’t/don’t want to get pregnant
- Not sure/prefer not to say
This left us with responses from 773 women who we can reasonably assume have or wish to become pregnant in their lifetimes.
Using this data pool we found:
| Think about previous or future pregnancies you may have. If given a choice, what type of birth, if any, would you have chosen/choose? | |
| Response | % of Women Who Gave this Response |
|---|---|
| Natural birth in a medical setting (hospital or birth centre) | 64.81% |
| C section | 15.01% |
| Home birth | 12.94% |
| N/A – I didn’t / wouldn’t choose a specific option | 6.08% |
| Other | 1.16% |
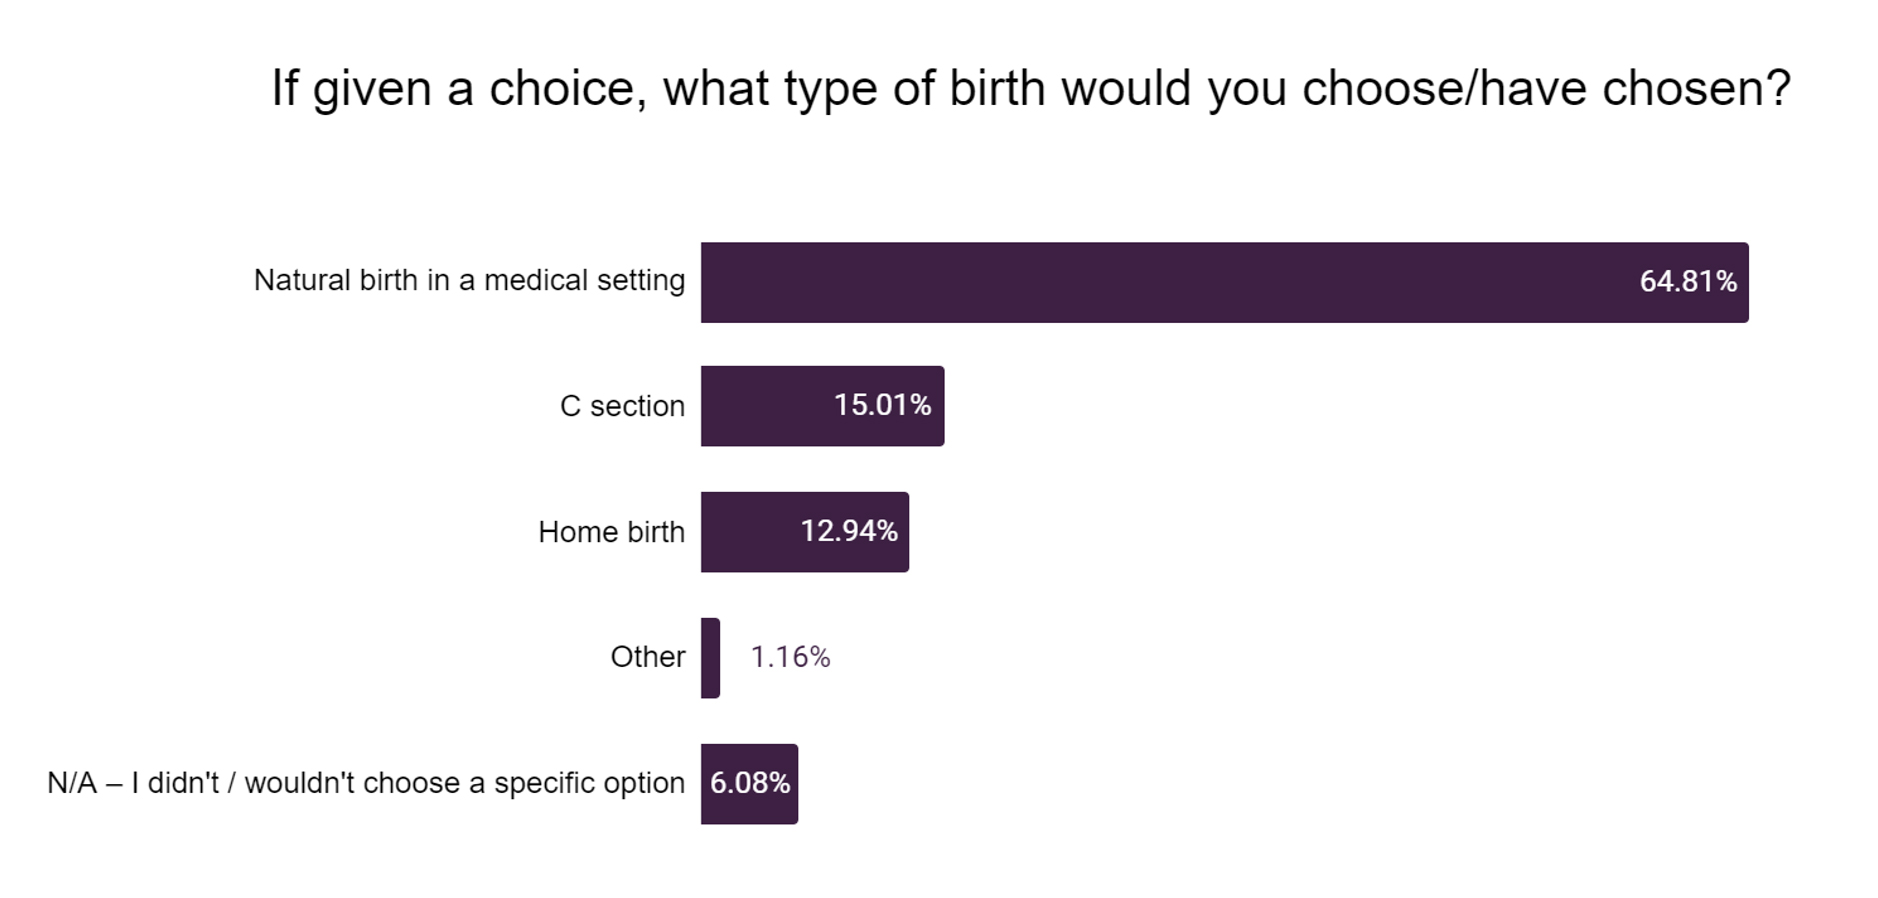
Almost two thirds of women would choose a natural birth in a medical setting, while 15% would opt for a c section.
This 15% figure is largely in line with official figures from the NHS which state 16% of births are elective sections (representing around half of all c sections here).
12.94% would choose a home birth, while the remainder opted for “other” or said they simply wouldn’t choose a specific option at all.
Preference for a C Section Varies by Age
Our statistics found the likelihood of a woman opting for a c section as a first choice varies by age.
When we break responses down into age groups, this is the proportion of each who would opt for a caesarean.
| Age Group | Proportion of women who, if given a choice over the type of birth with previous or future pregnancies, would choose a c section |
|---|---|
| 16-24 | 13.7% |
| 25-34 | 28.23% |
| 35-44 | 21.78% |
| 45-54 | 19.67% |
| 55+ | 7.92% |
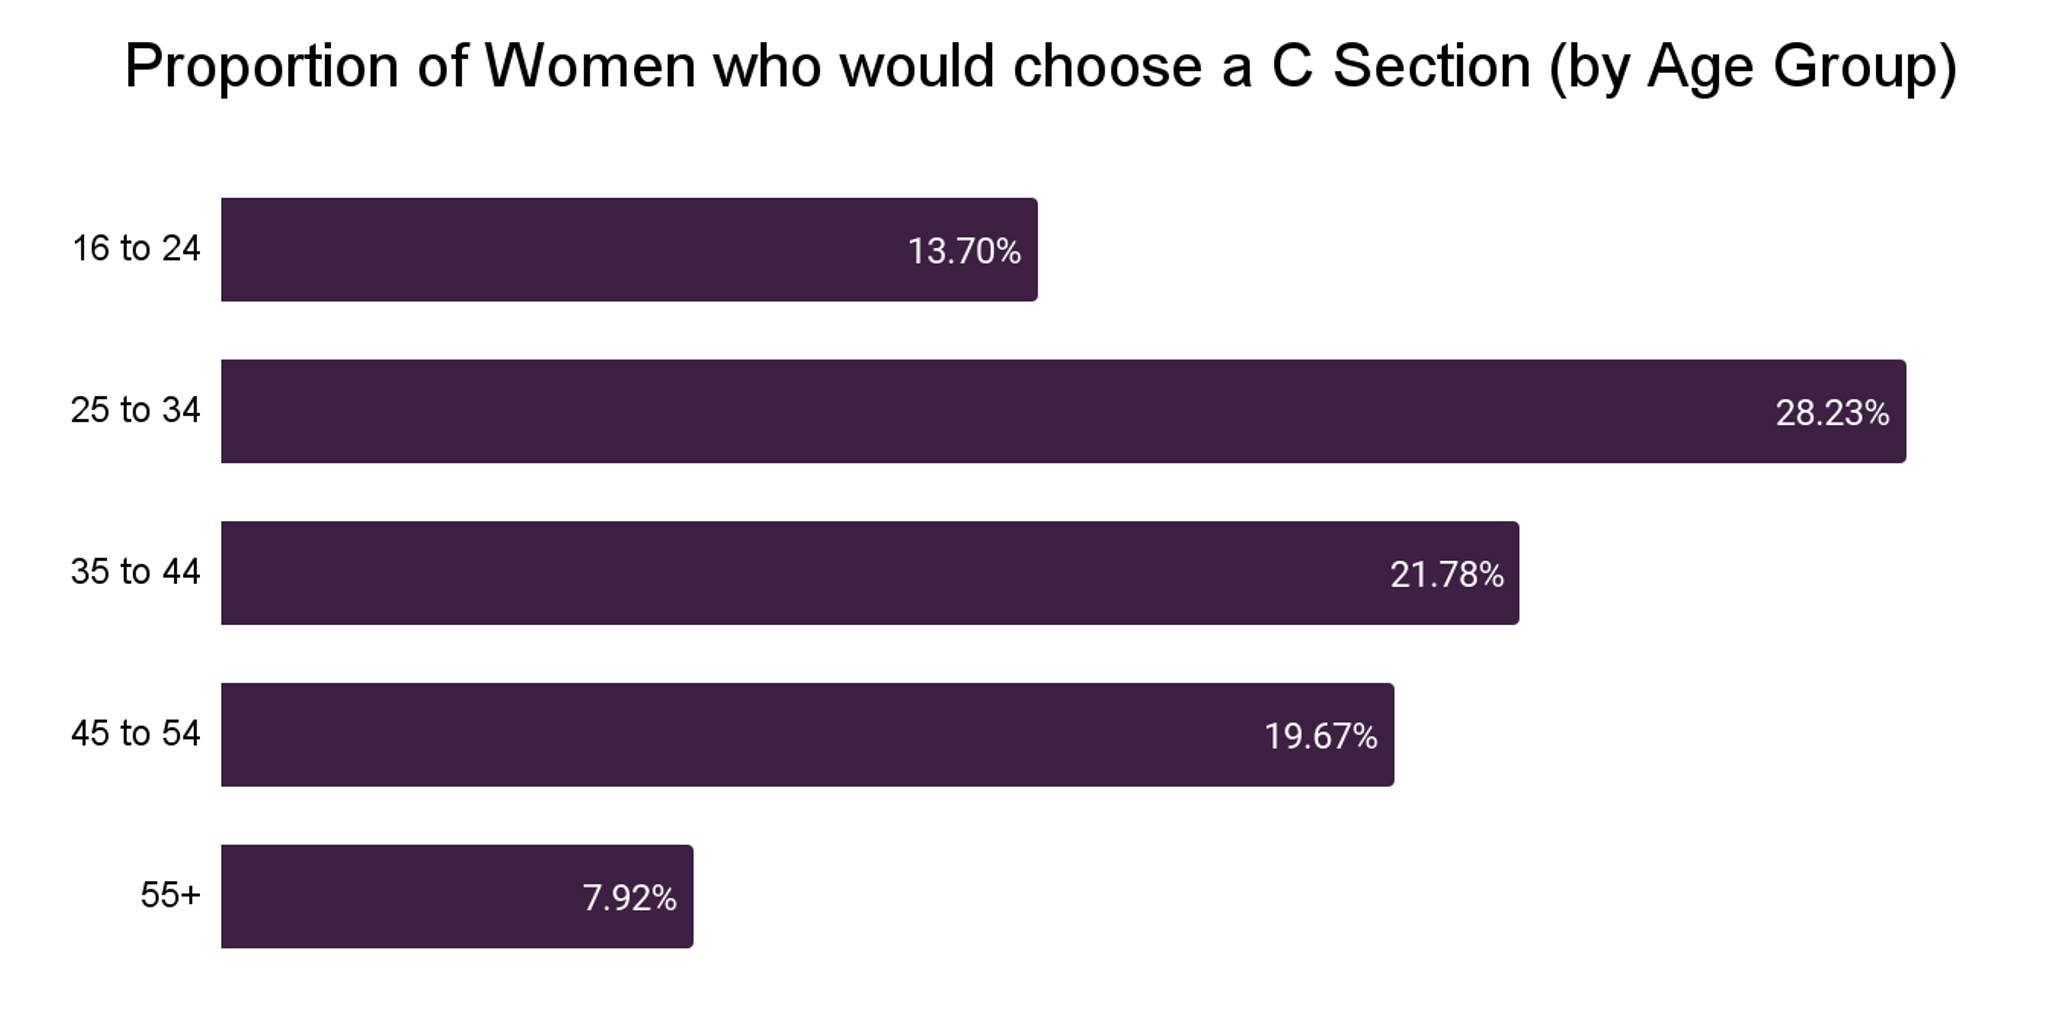
Women aged 25 to 34 are the likeliest to choose a c section, with over a quarter saying this would be their preference for childbirth.
This is closely followed by the 21.78% of 35 to 44 year olds who said the same.
Preference for a C Section Varies by Region
When we broke our respondents out into parts of the United Kingdom they come from we saw further variance as well.
Let’s take a look at statistics for the proportion of women, by region, who would choose a c section:
| Region | Proportion of women who, if given a choice over the type of birth with previous or future pregnancies, would choose a c section |
|---|---|
| East of England | 10.26% |
| Greater London | 12.36% |
| East Midlands | 19.61% |
| West Midlands | 9.84% |
| North East | 10.71% |
| North West | 15.79% |
| Northern Ireland | 37.14% |
| Scotland | 23.58% |
| South East | 7.78% |
| South West | 6.25% |
| Wales | 20% |
| Yorkshire and the Humber | 12.5% |
There’s huge variation in responses here, with as few as 6.25% of women in the South West stating a preference for a C section, and the equivalent figure in Northern Ireland being a huge 37.14%.
Preference for a C Section Varies by Income
We were also able to break down the responses to our poll by income (respondents’ own wage). Here’s what our statistics found:
| Wage | Proportion of women who, if given a choice over the type of birth with previous or future pregnancies, would choose a c section |
|---|---|
| £15,000 or less | 12.95% |
| £15,001 – £25,000 | 13.26% |
| £25,001 – £35,000 | 16.67% |
| £35,001 – £45,000 | 27.03% |
| £45,001 – £55,000 | 19.15% |
| £55,001 and over | 17.14% |
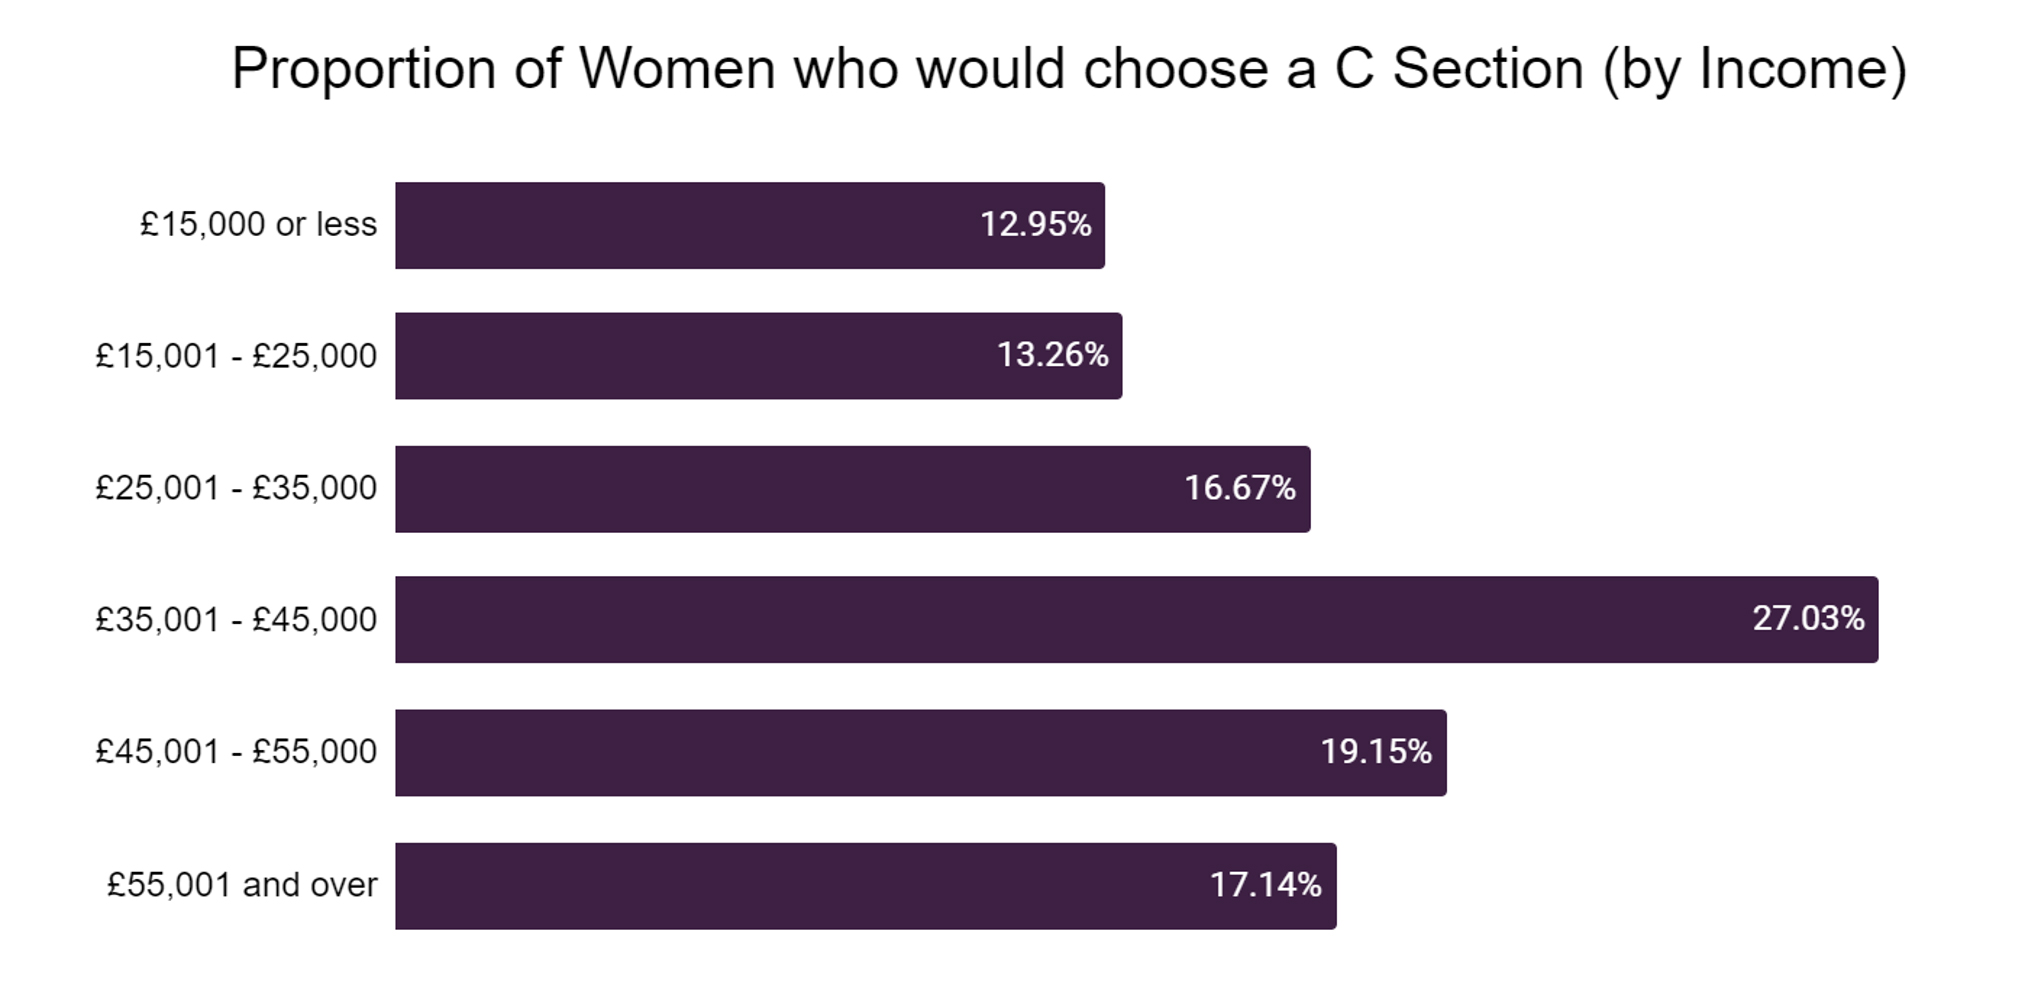
Those in the £35,001 to £45,000 bracket are the likeliest to opt for a c section given the choice. According to our figures, over a quarter would choose this.
This is followed by the £45,001 to £55,000 earners, of whom 1 in 5 would elect for a c section.
Those least likely to choose a c section as their first choice when it comes to childbirth are the lowest earners. Just 12.95% of those earning under £15,000 would opt for a c section.
C Section Rates in the UK Compared to Global Figures
Unicef and the OECD compile global c section rate statistics periodically. We sought out data from those sources for any country who had published a figure more recently than 2017. We identified 102 such countries, which are listed below.
The c section rate by country ranges from just 1.1% (Chad) right up to 62.9% (Dominican Republic).
In the UK this figure sits at 34%, making it the 20th highest c section rate in this data set.
There are 6 countries in the world where the majority of births is by c section:
- Dominican Republic – 62.9%
- Turkey – 58.4%
- Brazil – 56.4%
- Turks and Caicos Islands – 55.2%
- South Korea – 53.8%
- Mexico – 52.6%
In all:
- There are 42 countries where the c section rate is over a quarter
- There are 24 countries where the c section rate is over a third
Here are the 102 countries for which data more recent than 2017 was available.
| Country | Proportion of Births that are C Sections (C Section Rate) | Year to Which the Most Recent Data Refers |
|---|---|---|
| Dominican Republic | 62.9 | 2019 |
| Turkey | 58.4 | 2021 |
| Brazil | 56.4 | 2019 |
| Turks and Caicos Islands | 55.2 | 2020 |
| South Korea | 53.8 | 2021 |
| Mexico | 52.6 | 2021 |
| Argentina | 46.8 | 2020 |
| Bulgaria | 46.5 | 2021 |
| Romania | 44.3 | 2021 |
| Tunisia | 43.2 | 2018 |
| Poland | 42.2 | 2021 |
| Georgia | 40.6 | 2020 |
| Maldives | 40 | 2017 |
| North Macedonia | 38.3 | 2019 |
| Bangladesh | 36 | 2019 |
| Ireland | 35.5 | 2021 |
| Hungary | 34.6 | 2021 |
| Thailand | 34.5 | 2019 |
| Vietnam | 34.4 | 2021 |
| United Kingdom | 34 | 2021 |
| Bolivia | 33.4 | 2019 |
| Iraq | 33.2 | 2018 |
| Switzerland | 32.6 | 2021 |
| Italy | 32.3 | 2021 |
| United States of America | 32 | 2021 |
| Serbia | 31.8 | 2019 |
| Austria | 31.7 | 2022 |
| Kosovo | 31.4 | 2020 |
| Belarus | 31.2 | 2019 |
| Cuba | 31.2 | 2019 |
| Malta | 31.2 | 2020 |
| Albania | 31 | 2018 |
| Germany | 30.7 | 2021 |
| Canada | 29.8 | 2021 |
| Slovakia | 29.6 | 2021 |
| New Zealand | 29.6 | 2021 |
| Croatia | 28.8 | 2021 |
| Luxembourg | 28.1 | 2021 |
| Peru | 26.3 | 2020 |
| Mongolia | 26.2 | 2018 |
| Jordan | 25.9 | 2018 |
| Palestine | 25.8 | 2020 |
| Algeria | 24.8 | 2019 |
| Honduras | 24.8 | 2019 |
| Czech Republic | 24.8 | 2021 |
| Montenegro | 24.4 | 2018 |
| Spain | 24.2 | 2021 |
| Costa Rica | 23.6 | 2021 |
| Pakistan | 23.1 | 2019 |
| Latvia | 21.9 | 2021 |
| Belgium | 21.9 | 2021 |
| India | 21.5 | 2021 |
| Slovenia | 21.4 | 2021 |
| Morocco | 21.2 | 2018 |
| Lithuania | 21.1 | 2021 |
| Finland | 20.7 | 2019 |
| France | 20.5 | 2021 |
| Tuvalu | 20.2 | 2020 |
| Estonia | 20 | 2021 |
| Fiji | 19.7 | 2021 |
| Denmark | 19.6 | 2021 |
| Sweden | 18.2 | 2021 |
| Indonesia | 17 | 2017 |
| Uzbekistan | 17 | 2018 |
| Suriname | 16.1 | 2018 |
| Norway | 15.6 | 2021 |
| Nepal | 15.3 | 2019 |
| Netherlands | 15.2 | 2021 |
| Iceland | 14.4 | 2021 |
| Israel | 14.3 | 2021 |
| Tonga | 13.6 | 2019 |
| Ghana | 12.9 | 2018 |
| North Korea | 12.9 | 2017 |
| Philippines | 12.7 | 2017 |
| São Tomé and Príncipe | 10.2 | 2019 |
| Kiribati | 9.3 | 2019 |
| Zimbabwe | 8.8 | 2019 |
| Togo | 8.6 | 2017 |
| Samoa | 8.4 | 2020 |
| Kyrgyzstan | 8.3 | 2018 |
| Malawi | 7.7 | 2020 |
| Turkmenistan | 7.7 | 2019 |
| Senegal | 6.9 | 2019 |
| Afghanistan | 6.6 | 2018 |
| Laos | 5.8 | 2017 |
| Haiti | 5.4 | 2017 |
| Liberia | 5.3 | 2020 |
| Tajikistan | 5.3 | 2017 |
| Benin | 5.1 | 2018 |
| Zambia | 5 | 2019 |
| Republic of the Congo | 4.7 | 2018 |
| Democratic Republic of the Congo | 4.7 | 2018 |
| Sierra Leone | 4.1 | 2019 |
| The Gambia | 3.7 | 2020 |
| Cameroon | 3.5 | 2018 |
| Guinea-Bissau | 3 | 2019 |
| Guinea | 2.7 | 2018 |
| Nigeria | 2.7 | 2018 |
| Mali | 2.5 | 2018 |
| Central African Republic | 2.2 | 2019 |
| Madagascar | 2 | 2018 |
| Chad | 1.1 | 2019 |
Google Searches Relating to C Sections
One way to get into the psyche of a population is to take a look at its Google search history. While we’re not able to peruse the history of the British public, we can look at data from Google (via kwfinder.com) about the number of searches made in Google UK in any given month for queries and keywords relating to caesarian sections.
We looked at the estimated number of searches per month in Google UK (going back to 2017) for the following keywords:
- vbac risks
- c section recovery
- elective c section
- benefits of elective c section
- caesarean section
- caesarean recovery
- caesarean section recovery
- caesarean section risks
| Keyword | Number of Searches in Google UK Per Month (Based on an average of the last 12) |
|---|---|
| vbac | 3700 |
| c section recovery | 9700 |
| elective c section | 3100 |
| benefits of elective c section | 470 |
| caesarean section | 9700 |
| caesarean recovery | 500 |
| caesarean section recovery | 490 |
| caesarean section risks | 170 |
But how have searches changed over time?
We looked back to January 2017, month by month, at searches in Google UK for these queries. We then took average for each year and found:
| Average Searches/Month in Google UK by Year | 2017 | 2018 | 2019 | 2020 | 2021 | 2022 | 2023 (to July) |
|---|---|---|---|---|---|---|---|
| vbac | 3117 | 3492 | 3550 | 4317 | 4342 | 3675 | 3971 |
| c section recovery | 1825 | 2058 | 2275 | 2442 | 2525 | 2750 | 3029 |
| elective c section | 3442 | 3808 | 4300 | 5433 | 8275 | 8850 | 9900 |
| benefits of elective c section | 11183 | 11917 | 13675 | 16725 | 18508 | 17550 | 18686 |
| caesarean section | 6350 | 6017 | 6400 | 7225 | 8725 | 8850 | 10214 |
| caesarean recovery | 1830 | 1398 | 1425 | 1300 | 1250 | 1300 | 1343 |
| caesarean section recovery | 2975 | 2833 | 2942 | 2992 | 3192 | 3075 | 3000 |
| caesarean section risks | 452 | 546 | 540 | 474 | 468 | 491 | 527 |
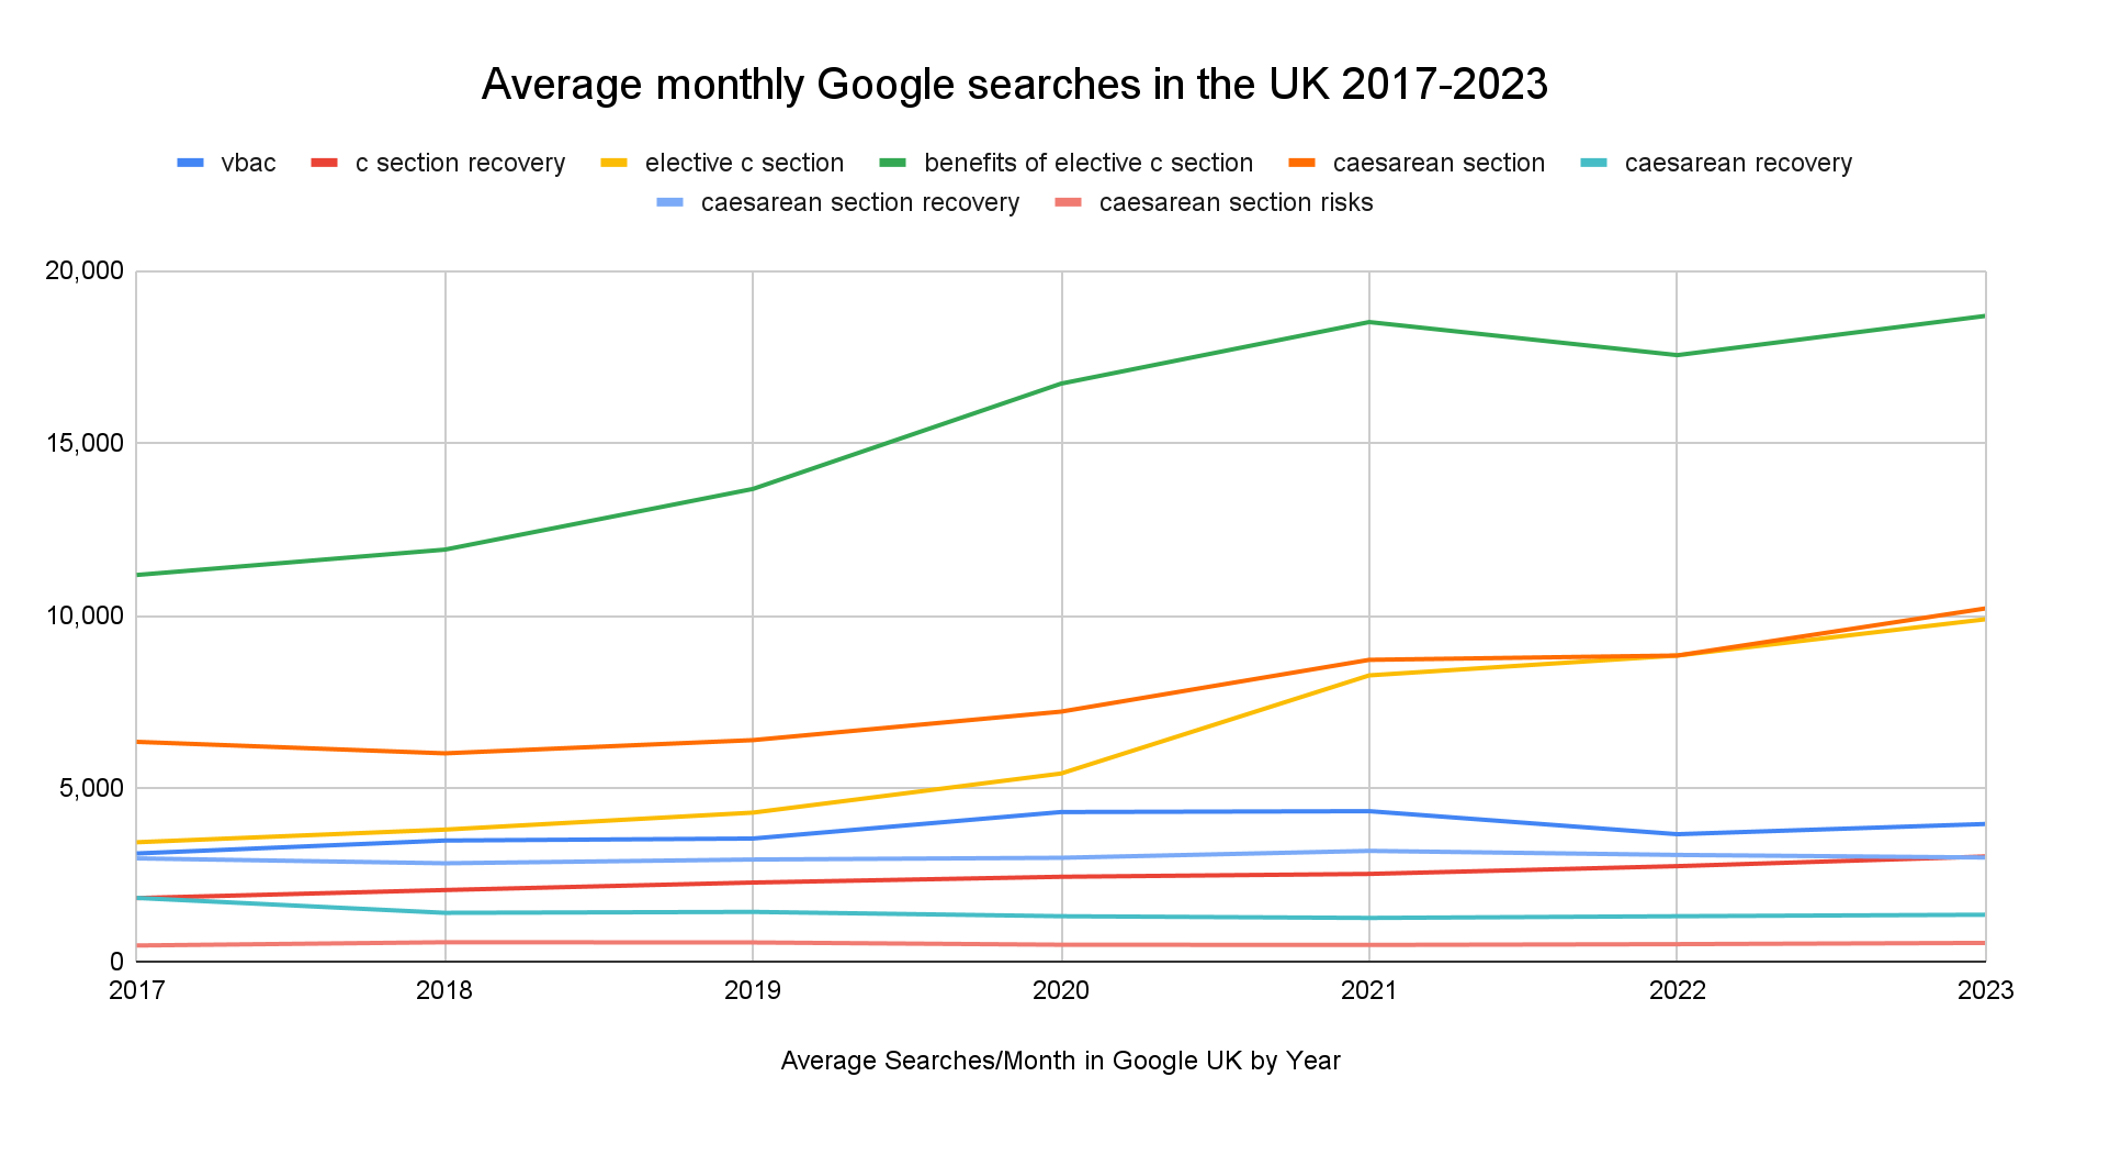
Every month in 2023, there are an average of over 18,000 searches in Google UK for ”benefits of elective c section,” up from 11,183 per month in 2017.
Interest in “elective c section” based on this data shows a growth in searches in Google UK – a 187% increase.
Thousands of searchers appear to be going to Google to get information on elective c sections, on c section recovery and on the possibility of vaginal births after a c section each month.
Other Key C Section Statistics
At the present time, the NHS is reporting c section rates by NHS trust, with the most recent data now over a decade out of date.
- However, the previous data from 2008 to 2009 shows that trust by trust, c section rates across England varied hugely from 14.9% up to 32.1%. This study also highlighted that the c section rate across the country as a whole in 2008 was around 1 in 4. This has increased to 1 in 3 currently.
- A 2002 Parliament document reports the C section rate as “1 in 5” as of October that year. This suggests a 50% increase in the percentage of births by c section in the UK from 1 in 5 in 2002 up to 1 in 3 at the present day.
- A University of Edinburgh study found that children born by c section have a 20% increase risk of asthma during childhood
- 6% of women who have a c section will go on to develop an infection
- 25% of women who have a c section but then go on in subsequent pregnancies to attempt a vaginal delivery will end up with a repeat c section in that delivery
How Safe is a C Section? Our Expert Comments
Dr Chrissie Yu, Consultant Obstetrician and Sub-Specialist in Fetal-Maternal Medicine writes:
“In the UK, around 1 in 4 pregnant women has a caesarean section, or C-section. It is an operation to deliver your baby through a cut made in your tummy and your womb. It’s usually only done if it’s the safest option for you and your baby.
Although a C-section is generally a safe procedure, it’s actually a major operation with a number of associated risks. The level of risk depends on things such as whether the procedure is planned or carried out as an emergency, and your general health.
Some of the main risks include wound infections or womb infections or, in rare cases, excessive bleeding or deep vein thrombosis. Antibiotics are now given to women before having a caesarean, so infections are becoming less common.
A C-section can cause problems in babies such as a cut in the skin, but these are usually minor and heal without any problems. Babies born before 39 weeks of pregnancy by C-section can have breathing difficulties, but things usually improve after a few days with monitoring in hospital.
Women who have a caesarean usually have no problems with future pregnancies.”
Methodology, Caveats and Raw Data
To acquire our survey data, we worked with Censuswide who provided a demographically representative sample of 1,040 women aged 16 and over in the UK. We selected this market research because they adhere to ESOMAR practices to ensure that data collection is as accurate as possible. They supplied data back to us broken down by age, region and income.
There were a number of answers made available to allow women to opt out of making a choice (e.g. if they don’t wish to become pregnant, simply don’t know or don’t have a preference). Where specified within this write up, we have disregarded answers from those who do not ever expect to become pregnant
For C section rates by country, we used data from the World Health Organisation (source). One notable thing to be aware of is that the years for which the data applies vary from country to country. We specified in the table which year the data refers to.
When it came to Google search trends, we looked at the number of searches (estimated) in Google UK for a number of queries relating to C sections. We used a system called KWfinder.com which pulls these estimated searches per month from Google Ads. Caveats of note:
- These figures are estimates
- One search does not necessarily equate to one unique searcher. A user could search the same query multiple times in any given month
- Someone searching for “VBAC” doesn’t mean they’ve had a C section. We make no assumptions about the intention of searchers
You can access all data used in the creation of our c section statistics roundup here